ADVANCED EFFORT MANAGEMENT
Advanced Effort Management (AEM) analysis gives organisations all the actionable insights they needs to optimise all their workforces.
It does this by leveraging the Effort Management Theorem (EMT) to:
A – Forecast Performance
B – Report at all levels
C – Suggest Interventions that Optimise
D – Visualise Impact (Delivery, Margins and Well-Being)
E – Compare Do Nothing, Optimum and Select Interventions
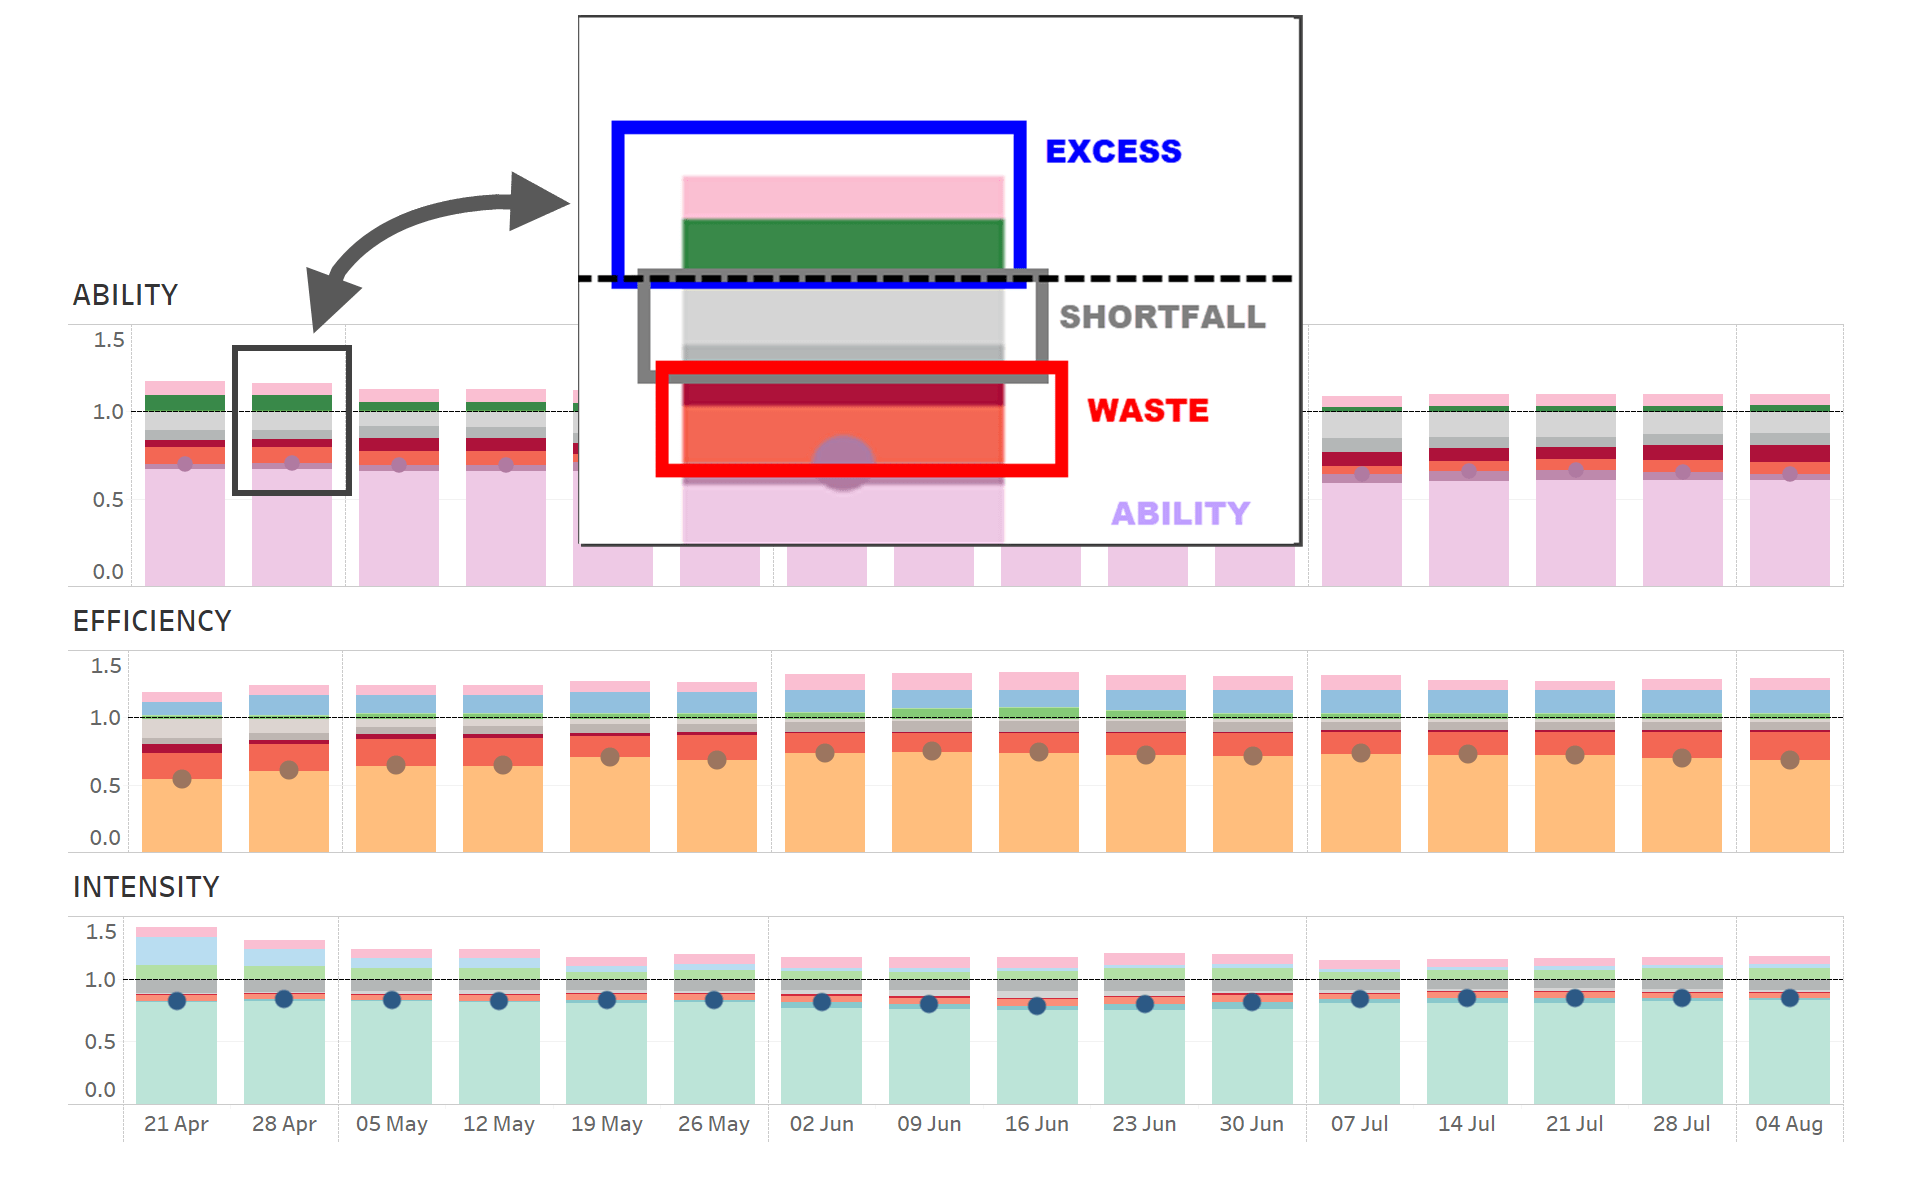
The identification of workforce waste, shortfall, excess and stretch drive powerful insights and interventions that will optimise your workforce.
A key principle of AEM is its ability to forecast both Potential and Intent for each Forecast Outcome called ABILITY, EFFICIENCY, INTENSITY. Potential is what could happen. Intent is what is planned. Potential and Intent are often not the same. When they deviate, they highlight the inevitable misalignment between a workforce plan and workforce allocation that responds to current needs.
A – Forecast Performance
There are three ways to forecast performance. EMT provides Forecasts Outcomes (A1), as described in Effort Outcomes and Effort Management Theorem. AEM goes on to predict Inefficiencies and Opportunities (A2) and Cost Impacts(A3).
2: Inefficiencies
AEM expands EMT forecasts by predicting Inefficiencies and five associated opportunities to optimise your workforce. These Opportunities are Shortfall and Excess, Under-Allocation and Over-Allocation, and Stretch. These opportunities can be predicted for each of the three Forecast Outcomes.
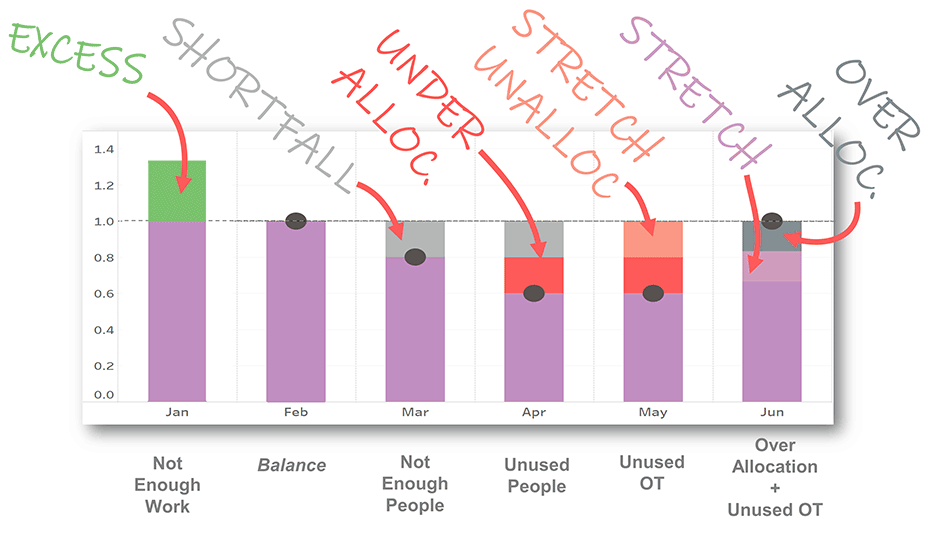
When a Potential Outcome is less than 1, then the predicted Outcome will fall short of an optimum outcome. For example, if we have 100 people and need only 80, then Efficiency Potential will be 0.8 and so SHORTFALL will be 0.2. This Shortfall could be corrected by obtaining more work, or downsizing the number of people. See Figure 1, February column.
When a Potential Outcome is greater than 1, then the predicted Outcome will exceed an optimum outcome. For example, if we have 100 people when we need 120, then Efficiency Potential will be 1.20, and so EXCESS will be 0.20. This Excess could be fixed by onboarding more people, or reducing the amount.
GAP occurs when organisations do not allocate enough people to work. SURFIET occurs when more people are allocated to work than are needed.
The difference between Potential and Intent is workforce inefficiency, caused by incomplete workforce allocation practices. UNDER-ALLOCATION occurs when organisations do not allocate ALL their people to work (often because they are unaware of people’s availability). This is common when there is poor visibility across siloed teams or business units.
Equally, OVER-ALLOCATION occurs when multiple tasks are assigned to people and the total amount of Allocation exceeds Capacity (often when there’s no consideration of when the work will take place and what the total required effort in a given period.)
Both Over-Allocation and Under-Allocation are avoidable types of workforce Waste. For example see Figure 1 April, column. If Ability Potential is 0.8 and Ability Intent is 0.6, then 0.2 of what should be delivered, cannot be delivered, and is wasted because of avoidable Under-Allocation.
FIGURE 1: Forecast Workforce Inefficiencies
People often increase their Intensity to complete their workload. People STRETCH their contribution in hours worked and the pace that they work at. This STRETCH increases Forecast Outcomes and reduces Shortfall. For example, people that are required to work 40 hours a week might be prepared to work 8 hours over time, which is 20% more. Furthermore, they might reduce this 8 hours of over-time to work at a faster pace. Either way, the same Outcome can be achieved.
Organisations thrive when their people STRETCH their contribution. This may/or may not be financially compensated. Long hours and excessive pace, without sufficient time for recovery, cause stress and are harmful to people’s wellbeing and health. It is also believed that longer hours actually reduce productivity and effect pace.
B – Report At All Levels
AEM communicates workforce Outcomes and Inefficiencies in three ways. Lowest Level (B4), Comparisons (B5) and Aggregation (B6).
B4 – Lowest Level
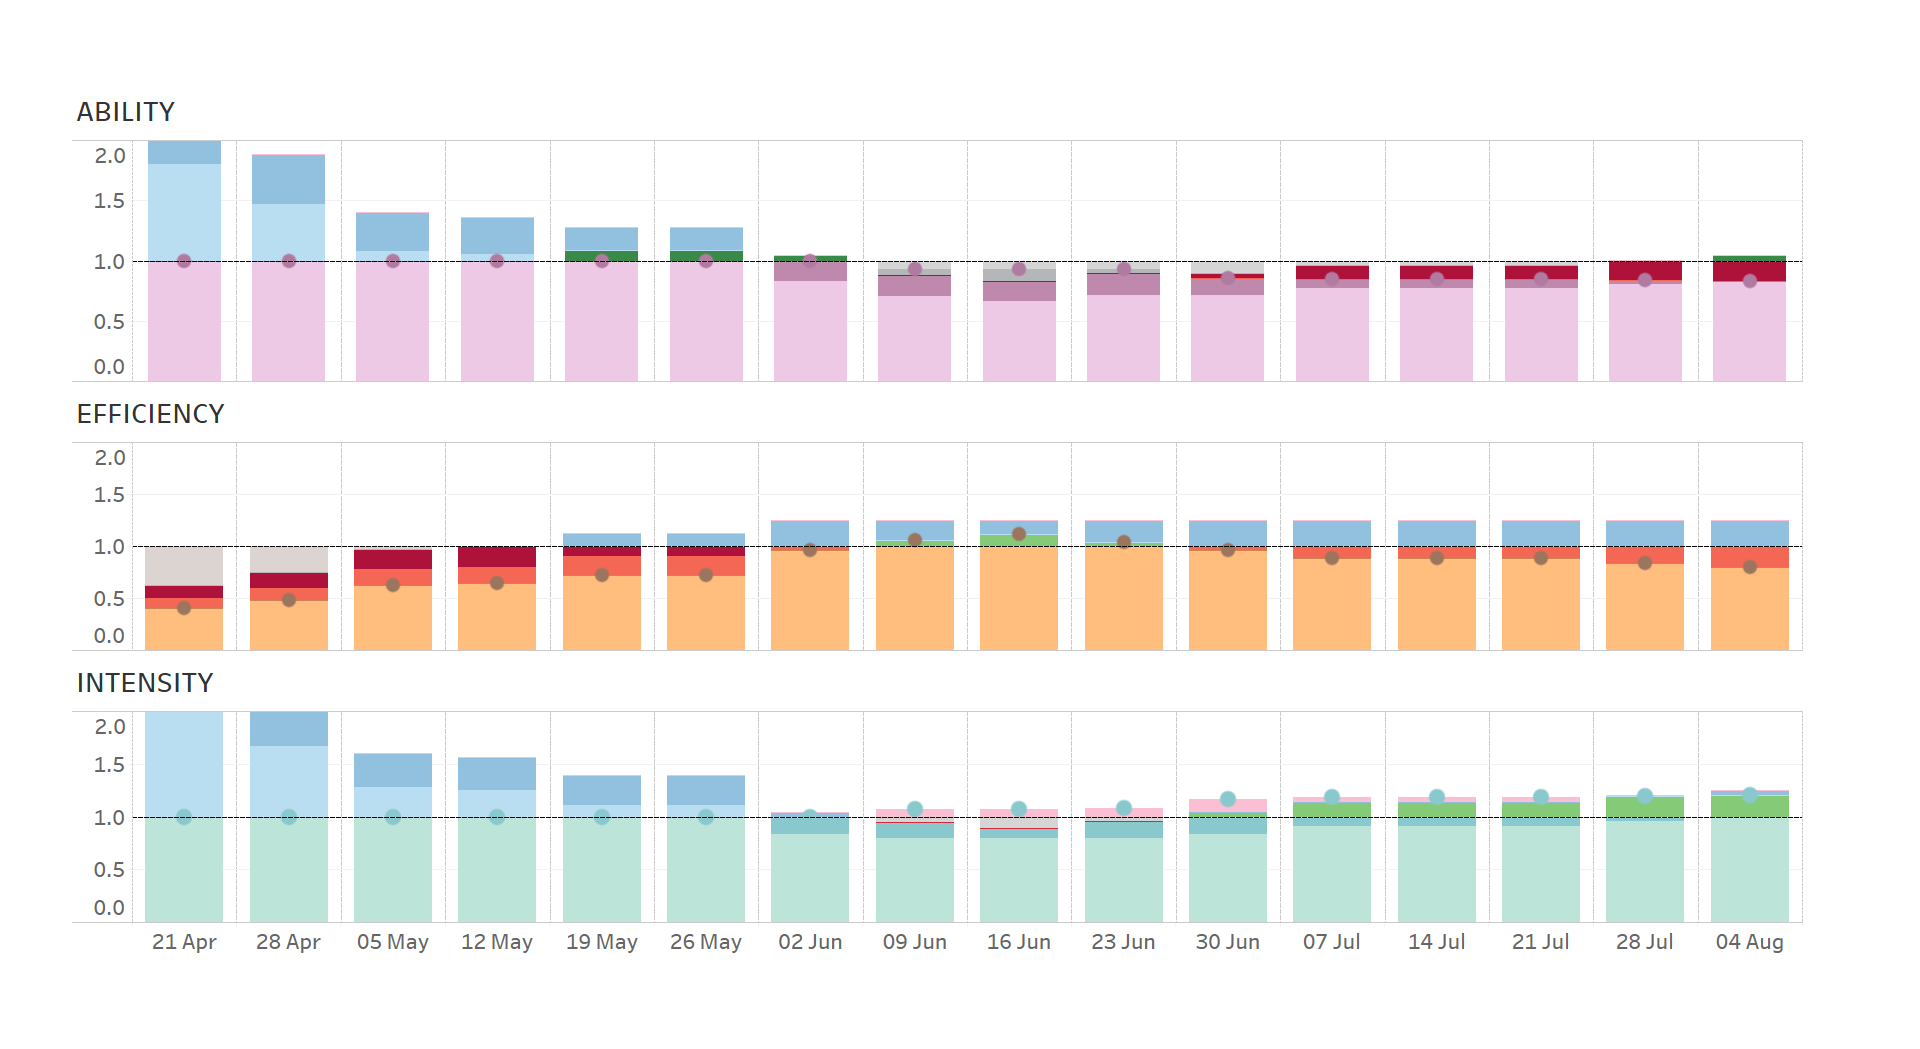
AEM analyses and reports at the smallest workforce Pool levels. For example it might forecast each Role, in each office. For each Forecast Outcome, a period by period bar chart presents Outcome Potential and Intent, and every combination of Opportunities. This would include the impact Stretch would have on the workforce. In a pool, either Shortfall or Excess can exist at the same time. Similarly, in pool only Under or Over Allocation can be present, not both.
FIGURE 2: Forecast Outcomes and Opportunities for Pool (e.g. A Role in an Office)
B5 – Comparisons
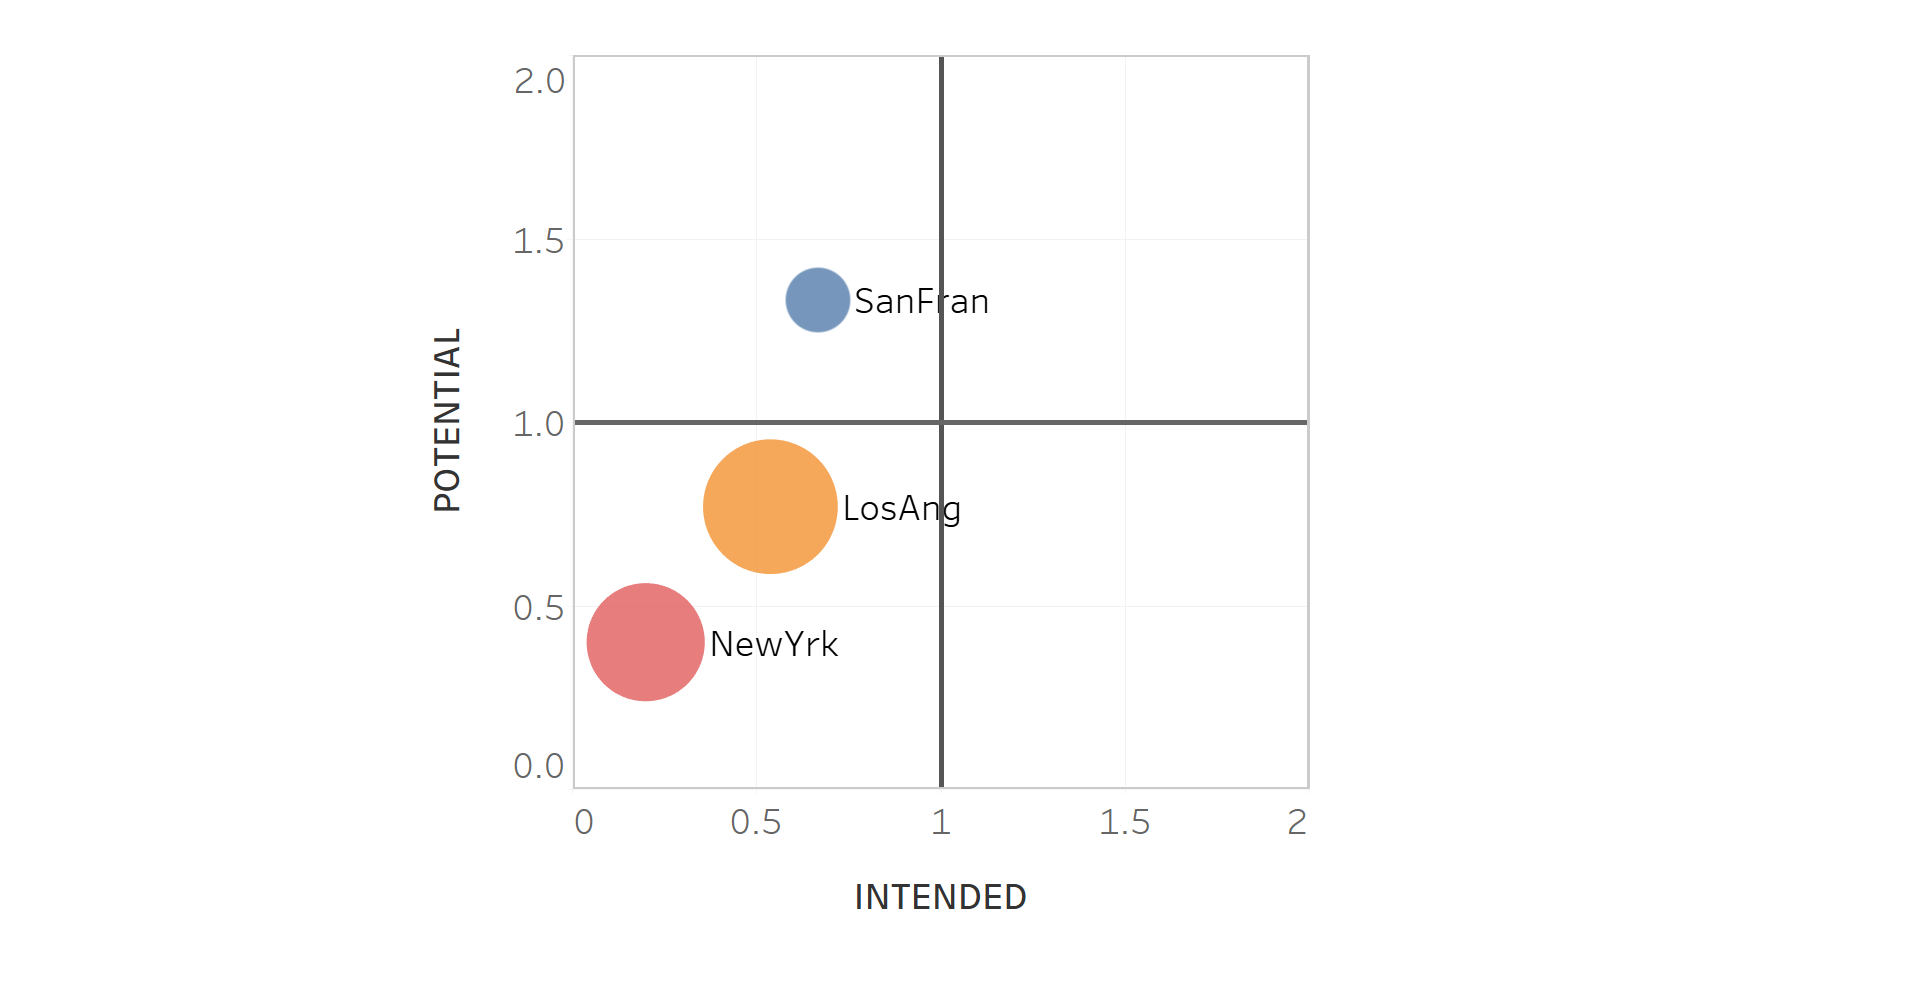
AEM allows us to compare workforce Pools at a glance. It allows us to see their differences, and know which are weaker and which are stronger. For each Forecast Outcome, a single chart will immediate convey Potential, Intent Outcomes and associated Inefficiencies, for each workforce pool. These charts, might for example, show Roles that have a Shortfall and others that have Excess. At the same time it will show those that have that have Gap/Surfiet and Under/Over Allocation. For example, there are people with Role X, In San Francisco, Los Angeles and New York and we can see their degree of imbalance and inferred interventions.
FIGURE 3: Comparing Workforces (e.g. Role X across offices)
B6 – Report At All Levels
AEM aggregates forecast Outcomes and Inefficiencies from workforce Pools (e.g. Roles) up into Ponds like teams, business units and into a Lake for the whole organisation. This is because every layer of management is accountable for their workforce. This is why they need to be able to balance their workforce with actionable insights.
Unlike workforce Pools, aggregated workforces will have a mix of Shortfall/Excess, Gap/Surfiet and a mix of Under/Over Allocation.
The way organisations manage their workforces varies greatly and this effects aggregated forecasts. Without interventions, each workforce Pool starts off as being ‘insoluble’ with others. For example, Roles with very different capabilities and skills cannot share work or people, so their aggregated forecasts will predict certain results.
Alternatively, people in one Role could be retrained and transitioned into an existing Role and so forecasts will predict different results (that are hopefully better due to the optimisation). This means that numerical aggregation of Opportunities and Outcomes must incorporate the organisation’s structure and workforce constraints.
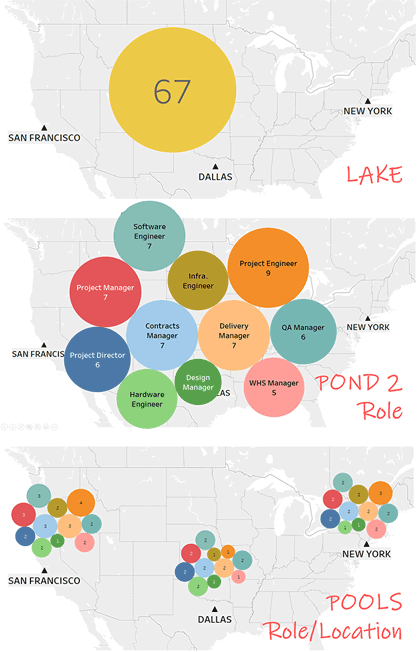
FIGURE 4: Aggregrate Workforces in Workfoces
Aggregation is not simple weighted averaging!
There are several factors that have prevented conventional forecasts from simply being added, or perhaps averaged, or even weighted averaged, because these would be incorrect. For example – the aggregated Efficiency (utilisation) of Role A and Role B with 0.8 and 1.6 respective Efficiency each – cannot be 1.2. What is the aggregated Efficiency? The answer lies in the way the organisation perceives its workforce, the interventions it is prepared to undertake and the way AEM treats these considerations.
Only AEM has the framework to provide meaningful forecasts that represent an organisation’s nuances.
FIGURE 5: Aggregated Outcomes and Opportunities for the whole organisation
An executive board can now see a forecast of its workforces Outcomes, Opportunities and Cost Impacts – summarised for the entire workforce – on a single chart. Now, for the first time, executives understand their workforces better than they understand their finances.
C – Suggest Interventions that Optimise
AEM can recommend 9 different interventions that will optimise your workforce. For example, it can recommend the number of people, or amount of work, to transfer between offices or departments. AEM will also suggest the interventions in a preferred sequence. This allows more preferable Interventions to be prioritised and residual Inefficiencies to be mitigated with more preferable Interventimons. For example, an organisation might prefer to transfer people or work before recruit, or even downsizing.
Here are 9 ways to optimise your workforce, that AEM can recommend.
1. Use Unused people
2. Stretch people with reasonable overtime.
3. Transfer – surplus to deficit of people or work
4. Horizontal Agility – use other capabilities
5. Vertical Agility – Junior roles done by senior people
6. Transition – reskill people into new roles
7. Onboard – recruit or contingent labour
8. Increase or reduce work
9. Downsize – reduce people numbers, only if necessary
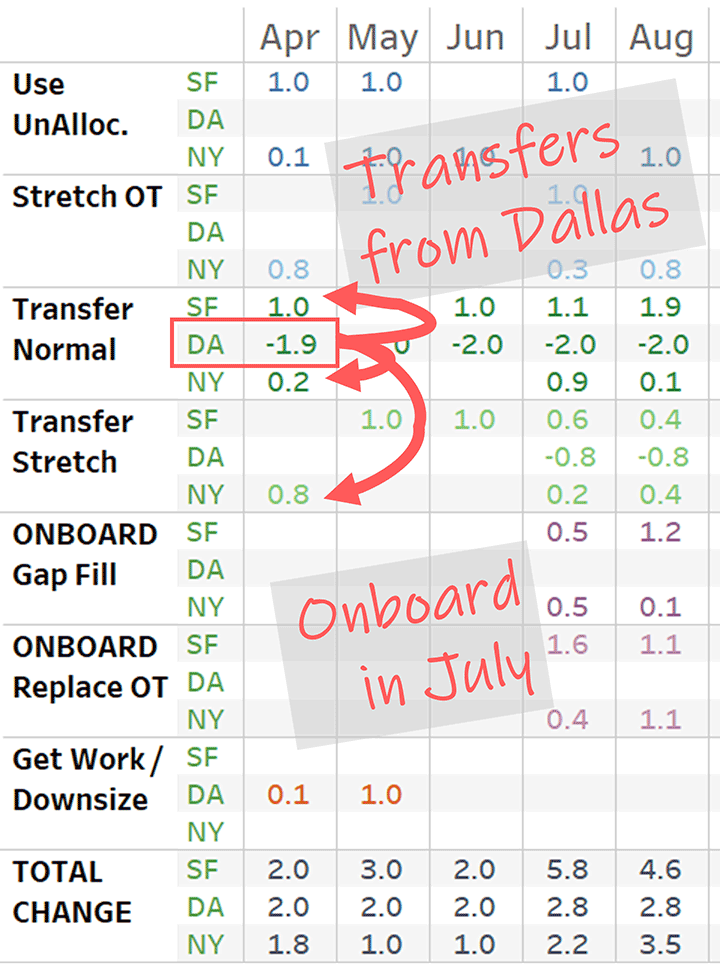
FIGURE 6: Suggested Interventions
D+E – Select and Assess Intervention Impacts
However, interventions that optimise may not always provide complete success. Good workforce decisions require compromise, depending on the organisation’s priorities.
Before making Intervention decisions, managers need to understand the impact of Do Nothing and Optimise and be able to unselect Interventions to see the impact this has on Outcome results. For example, when a manager chooses not to downsize the workforce they must accept surplus of delivery
D1 Margin Impact
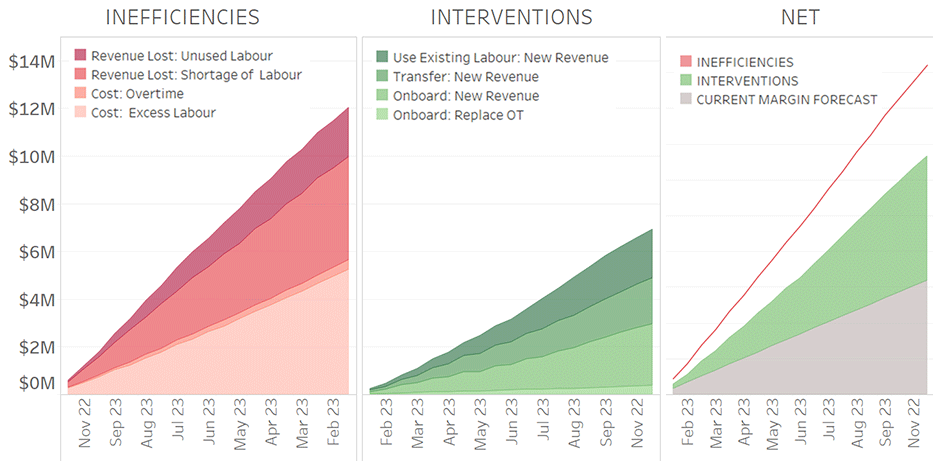
AEM exposes the MARGIN IMPACT Inefficiencies, and Interventions by valuing either increase to revenue, or reduced costs, ultimately increase in operating margins and profit. (or ‘value for money’ if a ‘not for profit’ organisation).
Every day that these opportunities are not realised, value is lost. Organisations with inefficiency costs that are greater than their operating margin, could double their margin – if they fully realise all their opportunities.
FIGURE 7: Impact To Margins
Organisations can now justify and prioritise workforce decisions based on Cost Impact
D2 Well-Being + Performance Impact
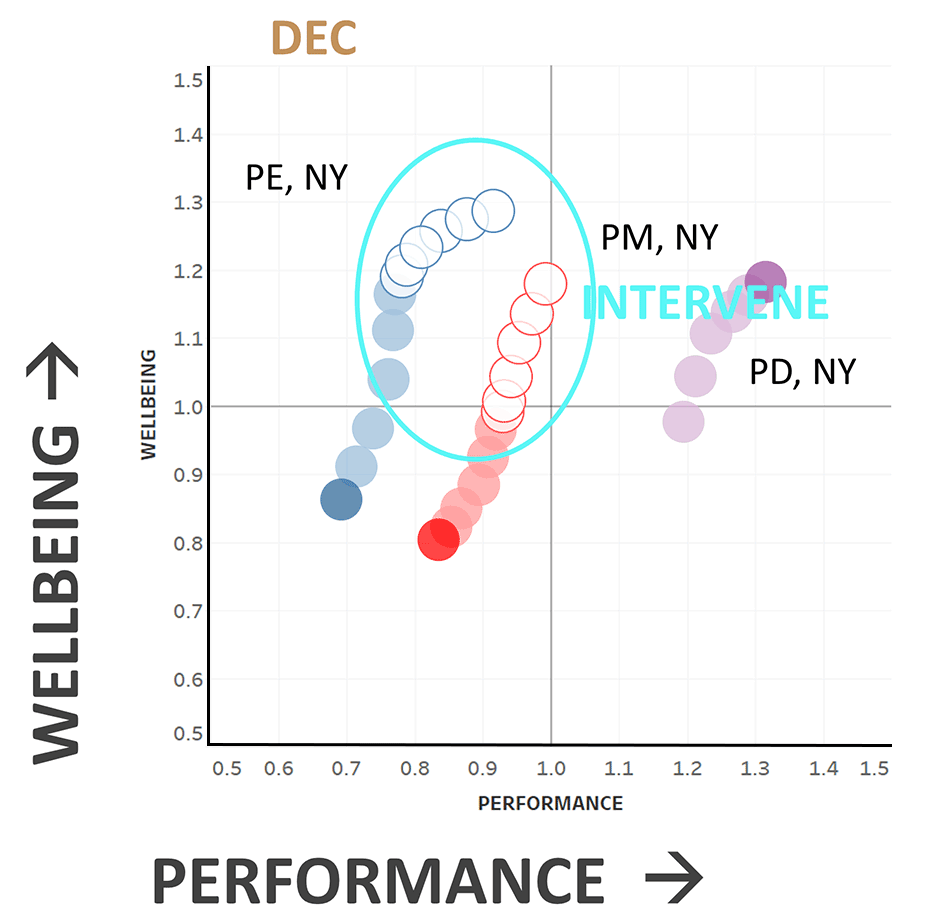
AEM has the potential to forecast the impact on people’s well-being and performance from workload Intensity if no action is taken and if there are interventions.
This is recent development uses Intensity and its influence on vitality, and is only made possible by EMT and AEM. These forecasts are based on workload and workplace factors that are derived from organisational psychology and well-being sciences.
FIGURE 8: Impact To Well-Being + Performance
Read more about Effort Management…
How To Harness Effort Management
RESRODEL is the ‘resource role model’ that leverages the power
of the Effort Management Theorem (EMT) + Advanced Effort Management (AEM) analysis
Resro.OPT analysis uses AEM
for optimising
all your workforces
Learn more about Resro.OPT
Resro.ACT software uses EMT
for balancing people + work
in activity based enterprises
Learn more about Resro.ACT

