EFFORT MANAGEMENT THEOREM
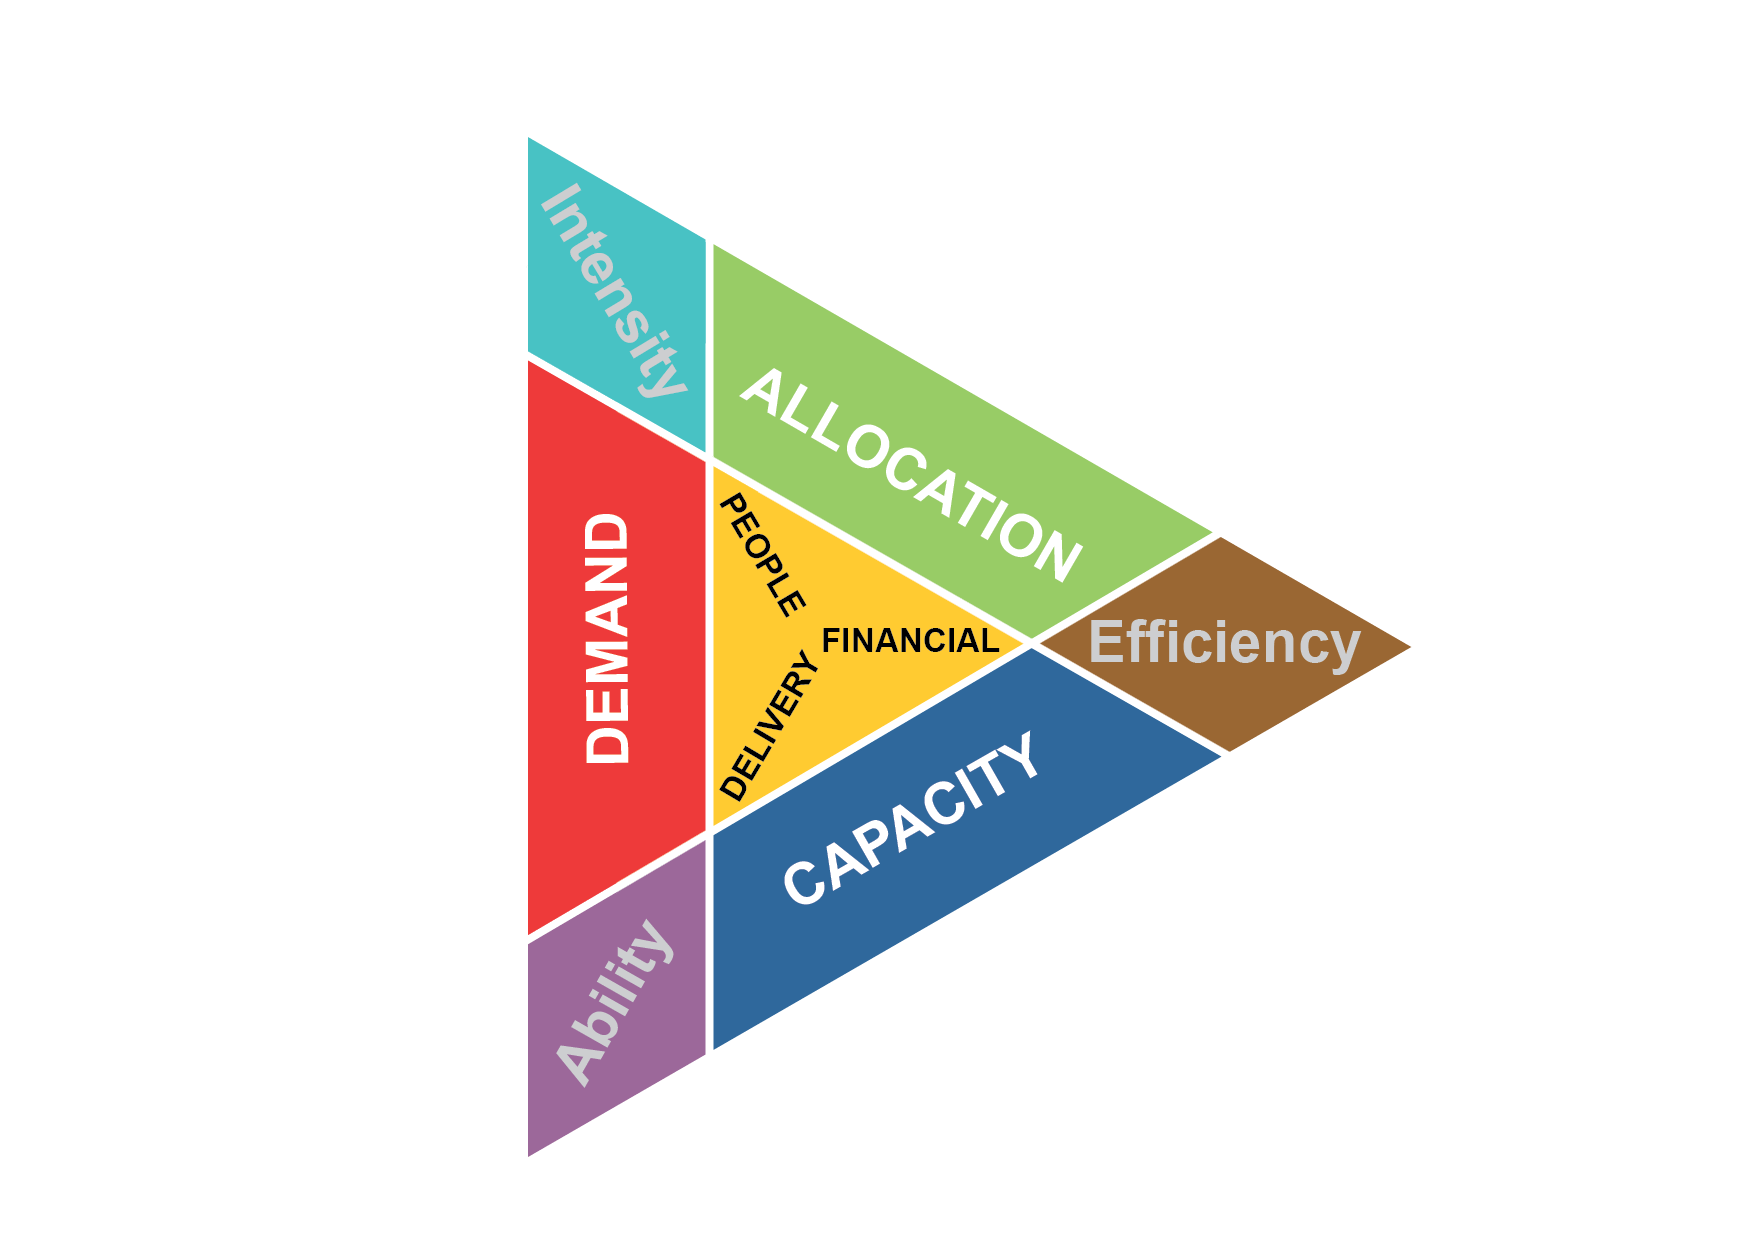
The Effort Management Theorem (EMT) sets out the fundamental relationship between three types of Effort and three forecast Outcomes.
Organisations that know how many people they will need, have and use, can produce x3 profiles of Effort called Demand, Capacity and Allocation. Effort can be for different period durations like days, weeks, months, quarters or even years.
Click here to read more about Effort.

When Demand, Capacity and Allocation are compared with each other, we are able to numerically predict forecast Outcomes called:
- ABILITY – to deliver commitments, or opportunities
- EFFICIENCY – productive use of people resources
- INTENSITY – how hard people are expected to work
Where:
ABILITY = Capacity vs. Demand
EFFICIENCY = Allocation vs. Capacity
INTENSITY = Demand vs. Allocation
These Outcomes can be presented as line comparisons, gaps and ratios.

FIGURE 1: Effort management Theorem
Types of Forecast Outcomes
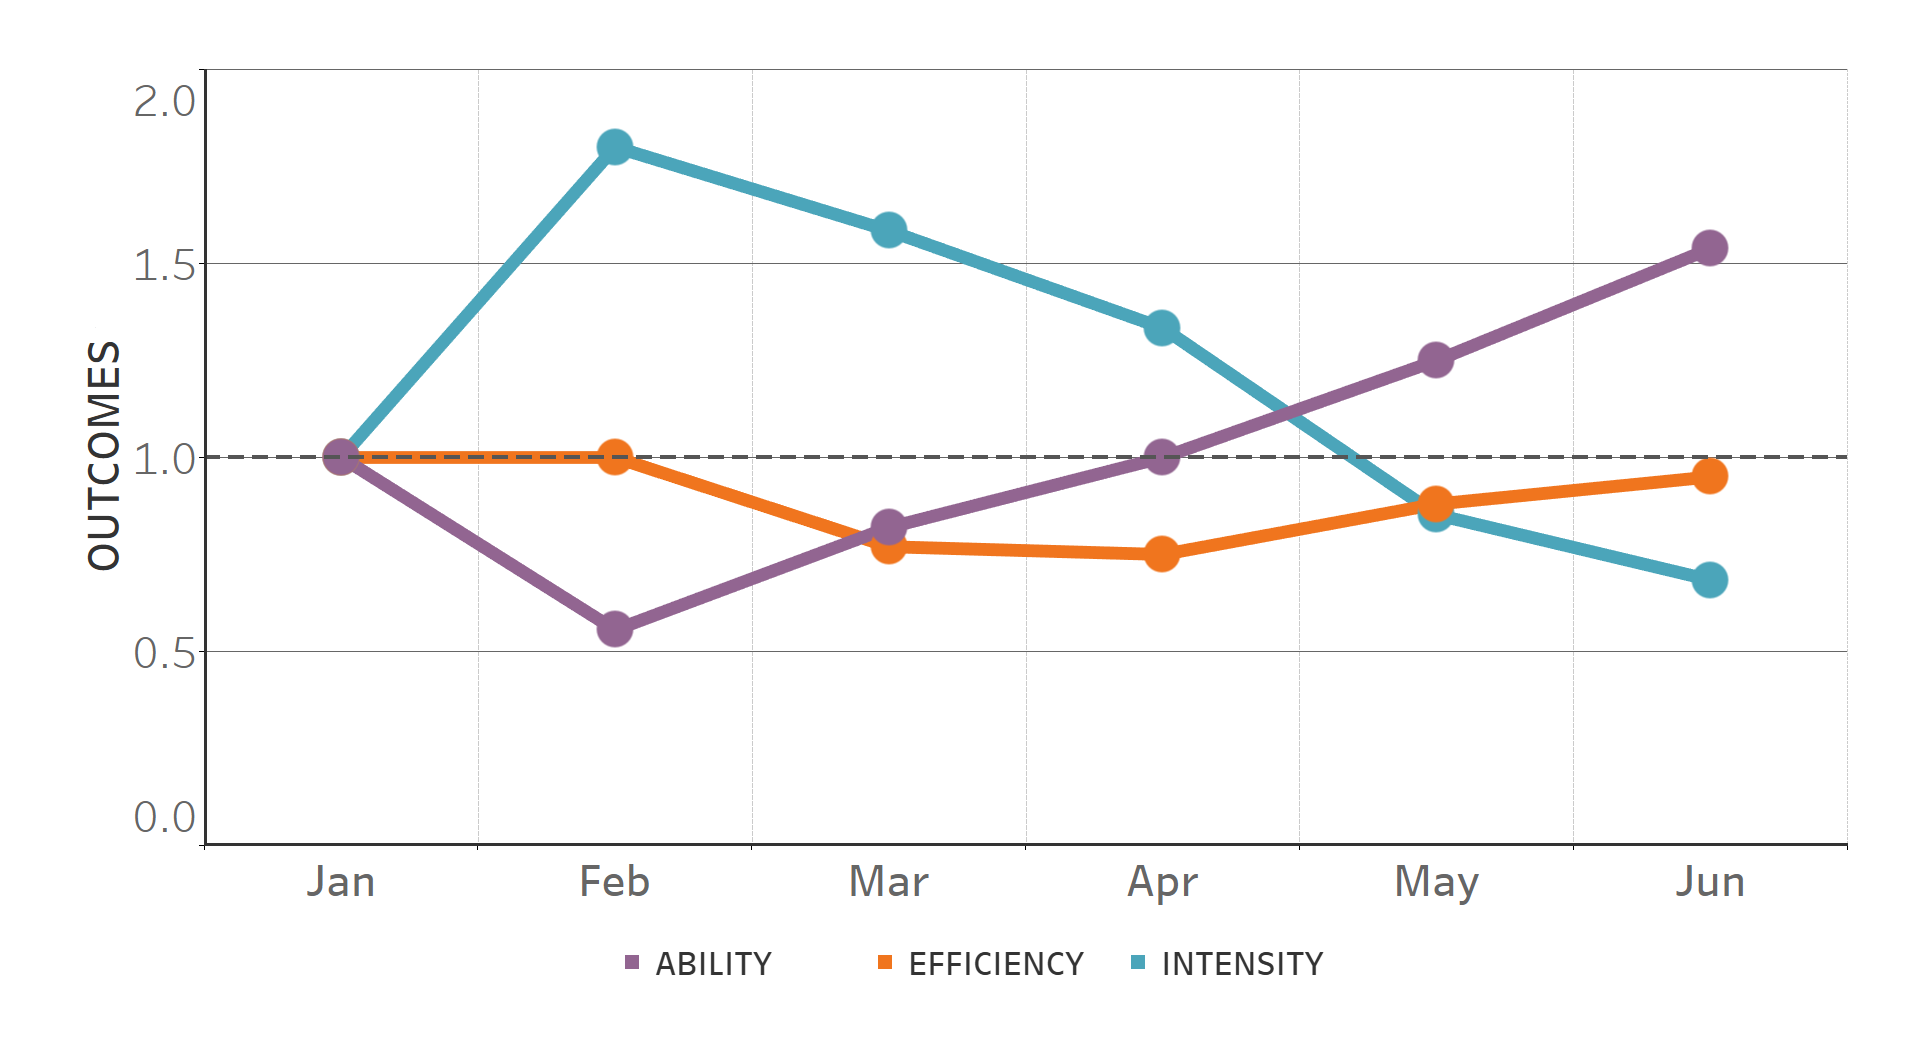
ABILITY is the forecast of Delivery. How much your workforce will be able to deliver, relative to the Demand to deliver. For example if 100 people are needed in a week and we have only 80, then ABILITY will be 0.8.
EFFICIENCY is a proxy for planned utilisation and Financial outcomes. How efficiently will we use our people resources? If nothing changes, if the Effort Profiles remain the same, then forecast EFFICIENCY is likely to be the resulting utilisation. If we have 80 people and have allocated work to only 60, then EFFICIENCY will be 0.75.
INTENSITY forecasts how hard people are expected to work. If 100 people are needed and only 60 are allocated, INTENSITY required from the 60 will be 1.66. That is, people will have to work 66% harder than usual. People respond to excess workload by working longer hours and/or at a faster pace. Both factors tire people. The negative effect of long hours have on stress, wellbeing, health and productivity are real and well known. The effect of pace is less discussed. Long hours over multiple periods of work reduce time to recover and fatigue will build.
Each forecast Outcome is a form for predicted productivity. ABILITY predicts productivity relative to what needs to be delivered. EFFICIENCY predicts productivity relative to number of people an organisation has. INTENSITY predicts productivity relative to the pace a typlical individual would work.
Armed with such insights, managers can now act earlier to better optimise Deliver, Financial and People outcomes.
This continuous, circular relationship between Effort Profiles and Forecast Outcomes is called the Effort Management Theorem (EMT). EMT is the heart of RESRODEL, the ‘resource role model’ and its solutions.
Scenario
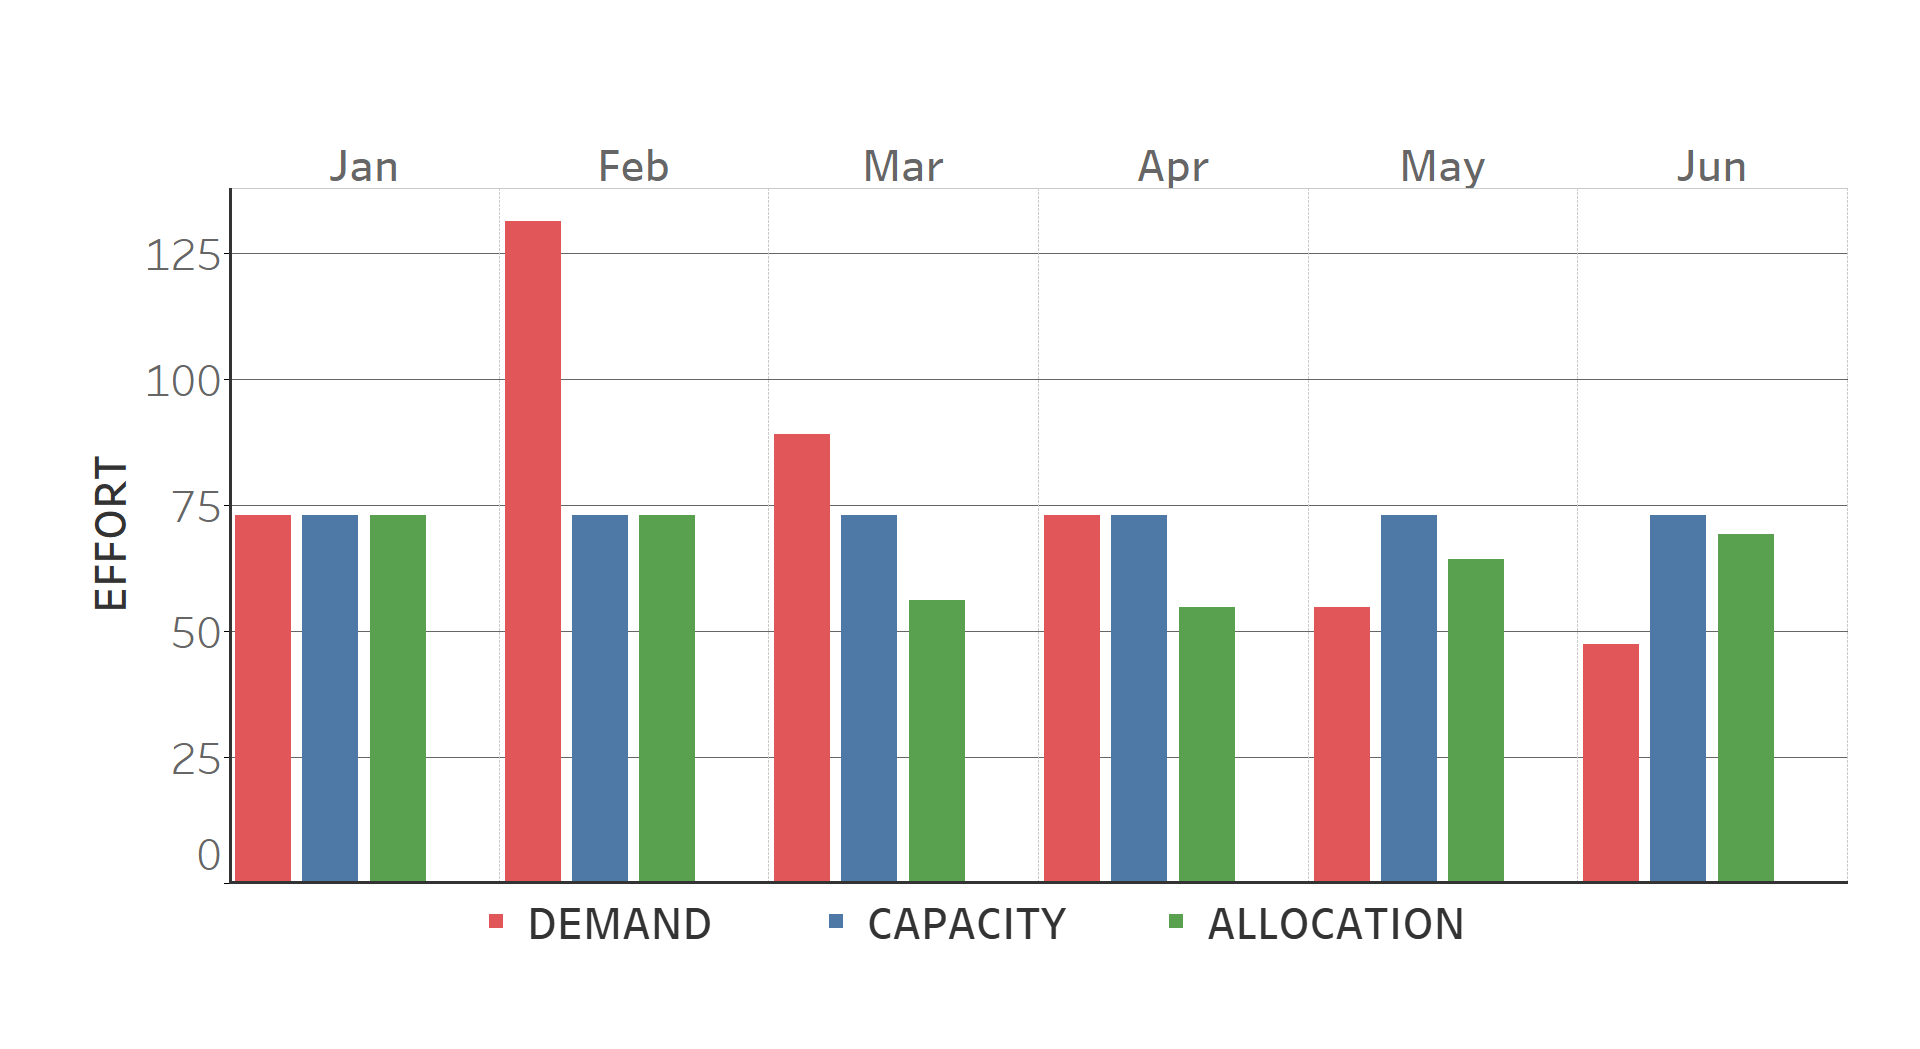
An enterprise employs 73 people in one Role. There’s an unplanned spike in Demand in February that severely exceeds capacity. Capacity remains consistent for 6 months. Allocation does not match capacity after February, for any number of reasons.
Figure 2 charts the forecast Effort Profiles and Figure 3 charts Forecast Outcomes for the Role. Table 1 describes resulting implications and potential actions that should be undertaken to optimise the workforce.
Learn more about charting Effort.

FIGURE 2: Effort Profiles (Demand, Capacity, Allocation)

FIGURE 3: Forecast Outcomes

TABLE 1: EMT Table
Read more about Effort Management…
How To Harness Effort Management
RESRODEL is the ‘resource role model’ that leverages the power
of the Effort Management Theorem (EMT) + Advanced Effort Management (AEM) analysis
Resro.OPT analysis uses AEM
for optimising
all your workforces
Learn more about Resro.OPT
Resro.ACT software uses EMT
for balancing people + work
in activity based enterprises
Learn more about Resro.ACT
